Lessons learnt from a precision soil mapping trial
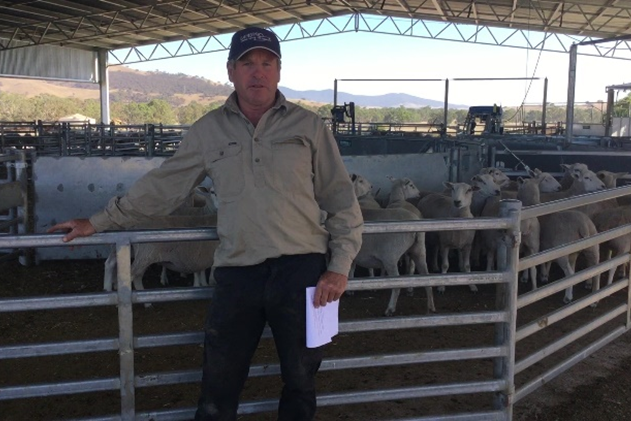
Caption: Scott Howell, Mt Lonarch. Image supplied.
Scott, Liz and Daniel Howell run a prime lamb enterprise at Mt Lonach near Amphitheatre, Victoria. The Howells’ farm was one of four properties to take part in the ‘Precision soil mapping in central Victorian pastures’ Producer Demonstration Site (PDS) project. The PDS aimed to demonstrate the potential of grid sampling soil to assess nutrient variability to tailor variable rate applications (VRAs) of fertiliser and ameliorants in grazing systems.
Scott became interested in the project after undertaking previous precision soil testing, which helped him to understand the variability of nutrients across their paddocks. He was keen to know if it was economically beneficial to undertake grid sampling and VRA over the whole farm, compared to their existing process of sampling along a transect across the paddock (avoiding sheep camps and under trees), combining samples for a single soil test.
Soil characteristics and nutrient levels across grazing paddocks can be highly variable due to soil type, stock camps, landscape variation, water movement and management.
Grid soil mapping provides a method of testing a paddock for variability in pH and nutrient levels. It's currently the most accurate method for developing VRAs, which utilise variable rate technology to match fertiliser rates to pasture requirements across an entire paddock. This approach is widely used in the cropping industry but has seen limited uptake in grazing systems in central Victoria.
The site provided an opportunity to map the distribution of soil nutrients across two neighbouring paddocks, apply a blanket fertiliser/ameliorant rate to one and VRA to the other (according to specified soil target levels) and re-map nutrients three years later to demonstrate the impact of VRA within a dynamic livestock system.
The site
The Howells manage 6,400 Primeline ewes at approximately 14 dry sheep equivalent (DSE)/ha. The farm is gently undulating and has granite-based sandy loam soil with the potential to leach nutrients.
Pastures consist of perennial rye grass, phalaris and sub-clover, with strategic plantain and chicory included in the system. The Howells also use a feedlot for finishing lambs and strategic containment feeding.
Standard soil testing is completed annually across a subset of paddocks. Nutrient management generally involves applications of 140kg/ha single super phosphate (SSP), 60kg/ha muriate of potash (MOP) and 10 units of sulphur. Lime is applied every 7–10 years, as part of the pasture renovation program, which involves a summer fodder crop, followed by two years of annual rye grass or clover, then perennial pasture.
Two paddocks used in the demonstration were undulating and had a phalaris/sub-clover base.
The Howells’ site utilised VRA technology for phosphorus, potassium and lime.
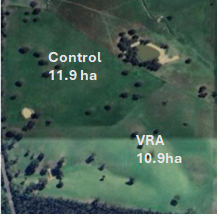
Aerial view of the site
The demonstration
Grid-based soil sampling was used to assess variability in soil nutrients across representative grazing paddocks at each of the four host farms. All paddocks were grid soil sampled at 0–10cm depth at a 1ha resolution (to best understand in-paddock variability) in December 2020.
Soil samples were tested for pH (CaCl2), Olsen phosphorus (P), Sulphur and exchangeable cations (potassium (K), Magnesium (Mg), Sodium (Na), Calcium (Ca)) at an accredited soil laboratory.
Subsoil samples were also collected at lower resolution (approximately every tenth grid square, targeted based on initial results) in 0–5cm, 5–10cm, 10–15cm, and 15–20cm increments to allow for identification of any pH stratification issues.
A producer steering committee developed paddock targets to address limitations to pasture production. Paired-paddock demonstrations were established to compare VRA versus the control which involved conventional blanket applications of key inputs (P, K and lime).
Application rates for the conventional applications were determined by the steering committee (using industry ’rules of thumb’), based on a single set of soil test results (the paddock average from grid sample points) to achieve the target level.
Similar management was used across the paired paddocks, including similar grazing strategies.
Return soil sampling was undertaken three years later (in 2023) to assess any changes in soil conditions.
Pasture composition, feed on offer (FOO), stocking rate and pasture quality were monitored throughout the project to assess any impact on livestock and pasture production.
Finally, the benefits and costs of using VRA versus conventional blanket (control) applications when applying key pasture inputs were assessed by comparing the costs and relative pasture production (benefits) of the two systems.
Table 1 shows starting nutrient levels in 2020.
|
Table 1: Initial pH (CaCl2), Olsen P (mg/kg) and potassium (mg/kg) for the control and VRA paddocks sampled in 2020 |
|
|
pH (CaCl2) |
Olsen P (mg/kg) |
Potassium (mg/kg) |
|
Control paddock |
4.6 (4.3–4.9) |
10.7 (8–14) |
121 (77–180) |
|
VRA paddock |
4.7 (4.5–5.0) |
11.5 (7–17) |
148 (77–208) |
Soil targets for the site included: pH of 5.2 (CaCl2), Olsen P at 15mg/kg, potassium at 150mg/kg. Tables 2 and 3 show paddock applications each year, including capital and maintenance fertiliser.
|
Table 2: Control paddock soil applications (lime, single superphosphate (SSP)) |
|
Control paddock |
Lime t/ha |
SSP kg/ha |
MOP kg/ha |
|
Year 1 |
2.5 |
140 |
50 |
|
Year 2 |
|
150 |
|
|
Year 3 |
|
102 |
|
|
Total |
2.5 |
392 |
50 |
|
Table 3: VRA paddock soil applications (lime, single superphosphate (SSP) and muriate of potash (MOP)) |
|
VRA paddock |
Lime t/ha |
SSP kg/ha |
MOP kg/ha |
|
Year 1 |
0.83 (0.5–1) |
234 (100–250) |
47 (0–300) |
|
Year 2 |
|
90 (0–250) |
21 (0–200) |
|
Year 3 |
|
118 (0–250) |
|
|
Total |
0.83 (0.5–1) |
442 (0–750) |
68 (0–500) |
|
Table 4: Final pH (CaCl2), Olsen P (mg/kg) and potassium (mg/kg) for the control and VRA paddocks sampled in 2023 |
|
|
pH (CaCl2) |
Olsen P (mg/kg) |
Potassium (mg/kg) |
|
Control paddock |
5.3 (5.0–5.8) |
12 (7–26) |
166 (72–414) |
|
VRA paddock |
4.9 (4.5–5.3) |
20 (12–58) |
249 (115–744) |
The results
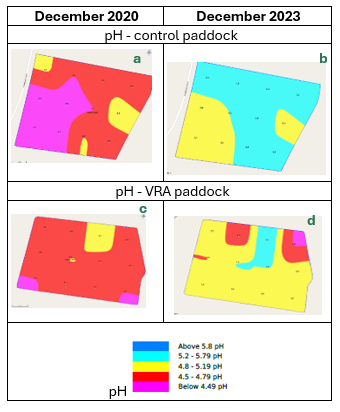
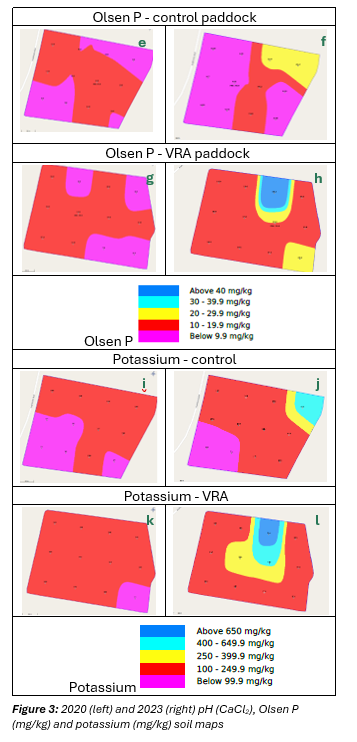
Initial (2020) and final (2023) soil maps are shown in Figure 3 and final soil test results (from December 2023) are shown in Table 4.
Lime: The control received 2.5t/ha, increasing the pH from an average of 4.6 to 5.3 (range of 5.0–5.8). In contrast, the 0.83 t/ha applied to the VRA paddock increased the average pH from 4.7–4.9 (range 4.5–5.3) falling short of the pH target of 5.2. The VRA lime rates assumed a high quality (Neutralising Value=95%) lime and did not take into account on-going acidification each year. Lime quality and on-going acidification in these high production pastures are likely to have affected the accuracy of the VRA treatment. Both the control and VRA paddocks finished with similar pH variability in the paddock.
Phosphorus: The control paddock received an annual maintenance rate of P over the three years, which was not sufficient to increase the Olsen P (average Olsen P initially 10.7, reaching 12) to the target of 15. It is likely that either the capital or maintenance P rate was not included in the first year.
In the VRA treatment, Olsen P levels increased in all but one grid soil sample. The VRA paddock got close to the target Olsen P of 15 across most of the paddock, except for two sheep camps (reaching an Olsen P of 58).
Across both the control and VRA paddocks, stocking rates increased during the demonstration period, increasing the levels of nutrients being exported from the paddock. This higher stocking rate was not accurately accounted for during the calculation of maintenance P, particularly in the final year of the PDS.
The higher stocking rate would also mean more nutrients were transferred across the paddock through dung and urine deposits, particularly to sheep camp areas (identified as yellow, aqua and blue on maps f and h). This caused Olsen P to increase in variability in both the control and VRA paddocks.
Potassium: The control treatment of 50 kg MOP/ha and VRA with an average application of 68kg/ha saw potassium levels increase in just over half of the paddock. Potassium was concentrated in the same areas of the paddock as P, due to stock redistribution of nutrients, reaching 774mg/kg K at the highest point in the VRA paddock. Once again, the increased stocking rate is likely to have exacerbated nutrient movement within and off the paddocks.
Pasture response/production
No consistent difference was measured in pasture production, stocking rate, pasture quality or pasture composition between the control and VRA paddocks at each of the four sites throughout the demonstration. The Howells' site recorded an estimated 1.1t dry matter (DM)/ha in the VRA paddock over the three years, however, this is unlikely to be statistically significant.
Economic outcomes
The economic analysis focused on the costs relative to the pasture production in the VRA and control paddocks.
The results presented in Table 5 show large differences in the soil sampling cost between the two treatments, with the 10.9ha VRA paddock equating to $817.50 (compared to a single soil test cost for the control).
Outside of project conditions, commercial grazing enterprises are undertaking 2ha grid sampling to best balance sampling costs whilst still providing practical variable rate solutions.
Table 5: Comparison of three-year (2021–2023) costs and pasture growth of the two soil management treatments.
|
|
Control |
VRA |
|
Total soil sampling cost ($/ha) |
$7 |
$75 |
|
Total capital fertiliser cost ($/ha) |
$159 |
$184 |
|
Total maintenance fertiliser cost ($/ha) |
$152 |
$70 |
|
Total treatment cost ($/ha) |
$318 |
$329 |
|
Total three year pasture growth (tDM/ha) |
19.6 |
20.5 |
|
Total treatment cost ($/tDM) |
$16 |
$16 |
The control paddock had a higher cost of applied nutrients (an extra $57/ha). This was largely attributed to higher amounts of lime, which achieved the pH target in the control. However, any savings from reduced fertiliser/ameliorant application on the VRA paddocks were offset by the high sampling cost of VRA. This, combined with minimal differences in pasture production between the VRA and control paddocks, meant that there was no evidence of any economic benefits of intensive point sampling for soil nutrient management.
These results demonstrate the benefits and costs of additional information. In part, this is a result of the law of diminishing marginal returns to extra inputs. This principle also applies to extra inputs of information to production decisions, as demonstrated by intensive point sampling relative to transect sampling.
Producer feedback
The biggest surprise for Scott was seeing just how much sheep moved nutrients around the farm – both within the paddock and off the paddock (particularly P and K). The soil maps also highlighted the impact of sheep camps and the importance of avoiding these areas when soil testing and spreading fertiliser.
Scott said that while he probably would not continue to grid map the whole farm, taking more than one soil test in a paddock in visually different areas could improve accuracy. However, a plan is needed on how the extra information is used. It may mean, when spreading, avoiding highly fertile areas or using lower or higher rates within a paddock. His advice to other grazing properties considering precision soil testing was to start small.
“Try precision soil testing a couple of paddocks first, to get a good understanding of the variation and the lay of the land before considering the whole farm. It’s great to understand your paddock, but it comes at a cost, and you need to weigh this up for yourself.
Scott said being a host site made him analyse his system a lot harder.
“You put a bit more effort in, but you get a huge amount more out.”