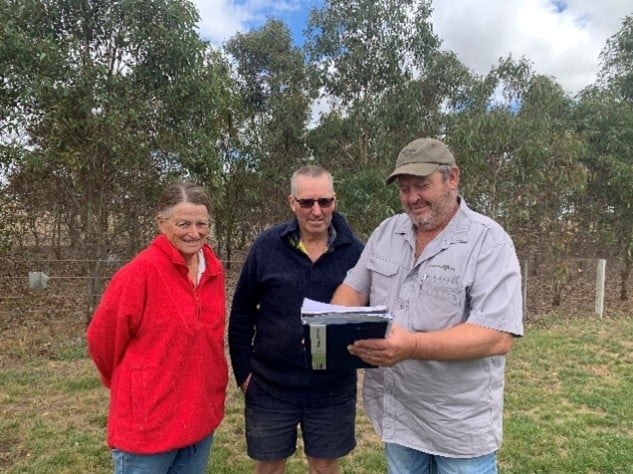
 Heather and Graeme Fagg with BestWool/BestLamb coordinator Neil James (Agriculture Victoria).
Testing soil mapping to improve pasture performance
Graeme and Heather Fagg, daughter Annie-May and son Tom manage a 4,000 head, 18.5-micron merino flock and 2,000 crossbred prime lamb property at Mt Mercer, near Ballarat, Victoria.
The Faggs were one of four host farmers from the Pyrenees and Smeaton BestWool/BestLamb groups who participated in the ‘Precision Soil Mapping in Central Victorian Pastures’ Producer Demonstration Site (PDS) project.
The project investigated how grid sampling soil could be used to assess nutrient levels within the soil. Understanding the differing levels could inform how to tailor variable rate applications (VRA) of fertilizer and ameliorants to grazing systems.
Graeme and Heather were eager to see whether grid sampling and VRA could improve pasture production and if costs were offset by benefits.
Grid soil mapping provides a method of testing a paddock for variability in pH and nutrient levels. It is currently the most accurate method for developing VRA, which utilises variable rate technology to match fertiliser rates to pasture requirements across an entire paddock. This approach is widely used in the cropping industry but has seen limited uptake in grazing systems in central Victoria.
The site
The Faggs’ property is gently undulating with clay loam soil. Their long-term average rainfall is approximately 600mm and they work on a 12 dry sheep equivalent (DSE)/ha carrying capacity.
The Faggs’ demonstration site used VRA technology for the application of lime and gypsum to an older pasture. The control was a phalaris/clover pasture and the VRA was phalaris/perennial ryegrass/clover, all with similar proportions of perennial grass and clover.
Historically, the Faggs soil sampled some paddocks and applied about 100kg of single superphosphate (SSP)/year across the farm with lime applied ahead of pasture renovations, as the budget allowed.
Pasture renovation for the Fagg family generally involves a fodder crop (turnips), followed by two years of cereals, before planting a perennial pasture (Figure 2).

The demonstration
Grid-based soil sampling was used to assess variability in soil nutrients across representative grazing paddocks at each of the four host farms involved in the PDS.
All paddocks were grid soil sampled at 0–10cm depth at a 1ha resolution (as per commercial standard practice) in December 2020.
Soil samples were tested for pH, Olsen phosphorus (P), sulphur (S) and exchangeable cations (potassium (K), magnesium (Mg), sodium (Na), calcium (Ca)) at an accredited soil laboratory.
Sub-soil samples were also collected at lower resolution (approximately every 10th grid square, targeted based on initial results) in 0–5cm, 5–10cm, 10–15cm and 15–20cm increments to identify any pH stratification issues.
A producer steering committee developed paddock targets to address limitations to pasture production. Paired-paddock demonstrations were established to compare VRA versus the control, which involved conventional blanket applications of key inputs (P, K, lime or gypsum).
Application rates were determined by the steering committee (using industry ’rules of thumb’), based on a single set of soil test results (the paddock average from grid sample points) to achieve the target level.
Similar management was used across the paired paddocks, including similar grazing strategies.
Return soil sampling was undertaken three years later (2023) to assess any changes in soil conditions.
Pasture composition, feed on offer, stocking rate and pasture quality were monitored throughout the project to assess any impact on livestock and pasture production.
Finally, benefits and costs of using VRA versus conventional blanket (control) applications when applying key pasture inputs were assessed by comparing the costs and relative pasture production (benefits) of the two systems.
Soil targets for the Faggs’ site included increasing pH to 5.5 and reducing exchangeable sodium percentage (ESP) to less than 6%.
The paddock treatments included:
Lime: The control paddock received the district ‘rule of thumb’ of 2.5t/ha. The VRA paddock received a variable application calculated to increase pH to 5.5, which equated to an average of 2.4t/ha.
Gypsum: The control paddock received district ‘rule of thumb’ of 2.5t/ha. The VRA paddock received a calculated rate to reduce ESP to less than 6%, assuming a 60% efficiency in the displacement of sodium from the soil. This averaged 0.6t/ha across the paddock.
Results
Lime: the control paddock started with an average pH of 4.6 in 2020 (range 4.6–4.8), which increased to 5.1 in 2023 (range 5.0–5.3) after receiving 2.5t/ha. The VRA paddock increased in pH from an average of 4.8 in 2020 (range 4.6–5.0) to 5.2 in 2023 (range 4.9– 5.3) after receiving an average 2.4t/ha. Both paddocks fell short of the 5.5 pH target and there was little change in the variability in soil pH due to the low variability in the initial sampling.
Gypsum: both the control and VRA gypsum applications reduced the ESP across the paddock to less than 6% (Figure 3). The control started with an average ESP of 7.5% (range 3.9–12.3%), which was reduced to 4.1% (range 2.5–5.5%) through application of 2.5t/ha. The VRA started with an average of 7.0% (range 5.6–11.3), which reduced to an average of 5.1% (range 3.8–6.1%) through the average application of 0.6t/ha.
Pasture response
No consistent difference was measured in pasture production, stocking rate, pasture quality or pasture paddocks throughout the demonstration. No additional benefit was measured in the VRA paddock compared to the control paddock.

Economic outcomes
The economic analysis focused on the costs relative to the pasture production in the VRA and control paddocks. The results presented in Table 1 show there were large differences in the soil sampling cost between the two treatments, with the 18ha VRA paddock equating to $1,350 (compared to a single soil test cost).
Ameliorant costs were higher in the control paddock. This is due to the ‘rule of thumb’ gypsum application of 2.5t/ha being a higher rate than was required to bring ESP below 6%.
By comparison, the VRA paddock had an application rate average of only 0.6t/ha, incurring a lower application cost.
The increased rate of gypsum in the control meant the paddock finished at a lower ESP than was required to hit the target. The rate and cost of lime were similar between the control (2.5t/ha) and the VRA (2.4t/ha).
|
|
Control |
VRA |
|
Total soil sampling cost ($/ha) |
$4 |
$75 |
|
Total ameliorate (lime and gypsum) cost ($/ha) |
$316 |
$162 |
|
Total maintenance fertiliser cost ($/ha) |
$159 |
$159 |
|
Total treatment cost ($/ha) |
$480 |
$397 |
|
Total 3-year pasture growth (tDM/ha) |
16.7 |
16.1 |
|
Total treatment cost ($/tDM) |
$29 |
$25 |
Table 1 Comparison of three-year (2021-2023) costs and pasture growth of the two soil management treatments.
The savings from reduced ameliorant application on the VRA paddocks were largely offset by the higher sampling cost of VRA.
These results demonstrate the benefits and costs of additional information. In part, this is a result of the law of diminishing returns to extra inputs. This principle also applies to extra inputs of information to production decisions, as demonstrated by intensive point sampling relative to transect sampling.
Producer feedback
Heather and Graeme said they’ve learnt a great deal from hosting the demonstration.
“It’s not a short-term project – improvements require a program to target the needs of each paddock. Grid soil testing helped us understand our paddocks but it's important with any soil testing to sit down with someone qualified to go through the results and work out what is needed,” Graeme said.
“We found it challenging to find someone to apply variable rate on our smaller grazing paddocks, but we have gone on to trial grid soil testing (2ha grid size) and VRA for lime and gypsum on our cropping paddocks this year.
“The BestWool/BestLamb group has been great for drawing out questions and answers on the topic. We are always happy to participate in trials that can improve our place and drive efficiencies.”