Feedlot firepower: Capacity climbs as prices surge
Key points
- The number of cattle on feed in Australia remains above 1.5 million head.
- Feedlot capacity continues to grow.
- Feedlot quarterly turn off approaches 1 million head.
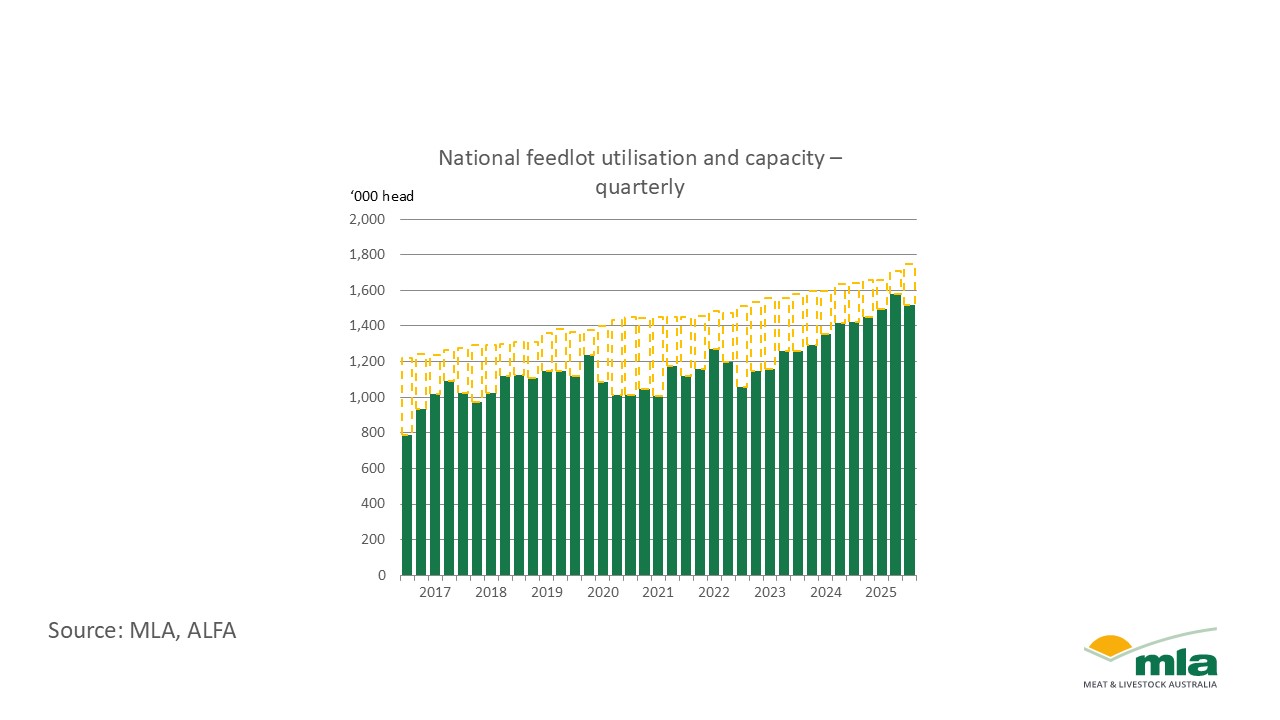
Australia’s feedlot sector held its momentum through the September quarter, with national capacity and grainfed exports both pushing toward new records. Even with a slight softening in numbers on feed, utilisation remains historically high − underscoring the sector’s central role in national beef production.
National overview

Australian feedlot capacity rose again this past quarter, up 3% to a record 1.75 million head, with the lift supporting strong throughput. Record June numbers on feed led to 962,436 head turned off in the September quarter, up 8% on the previous quarter and 12% on the same period in 2024. With a clear focus on productivity, high turnoff from feedlots remains a key driver of Australia’s record beef output.
Numbers on feed eased 4% to 1.52 million head, pulling utilisation back to 87%, but still well above long-term averages. This decline is better viewed as a short-term adjustment linked to higher prices rather than a signal of sustained change.
Domestic prices and supply
The cattle market continued to lift over the past quarter, even with significant volumes moving through saleyards. The National Livestock Reporting Service (NLRS) feeder throughputs lifted significantly in the September quarter. The Feeder Heifer Indicator hit record throughput, up 14% to 497,884 head. The Feeder Steer Indicator rose 13% to 661,111 − its highest throughput since 2015.
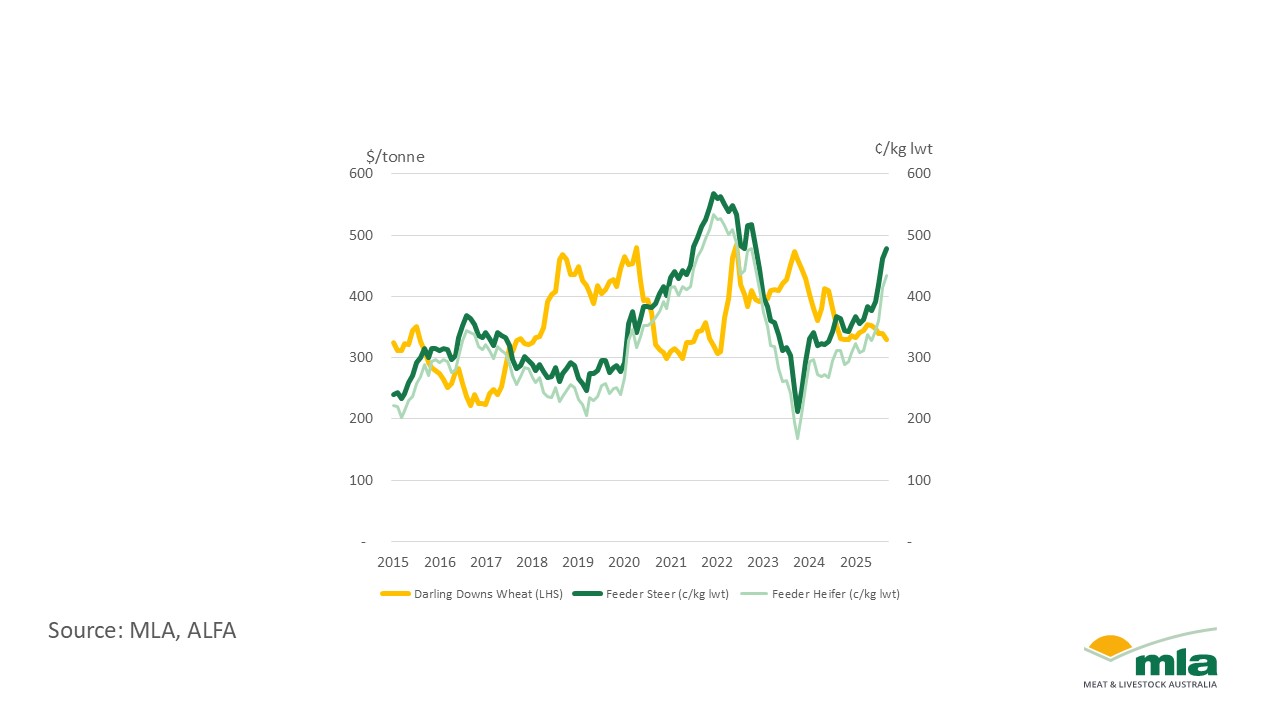
Similarly, prices continued to climb. The National Feeder Heifer Indicator averaged 407¢/kg liveweight (lwt) − lifting 21% or 71¢. The National Feeder Steer Indicator lifted 18% or 70¢ to 454¢/kg lwt. Both indicators reached their highest prices since 2022.

Cattle and feed remain the biggest cost drivers for feedlots. With cattle prices lifting, margins have tightened. Grain prices fell 4% but this offered only minor relief to lot feeders.
When cattle prices are high, fewer cattle usually enter feedlots, but feeding periods often lengthen as lot feeders push for weight gains to hold margins. Program length and average carcase weights will be worth watching over the next few quarters.
State-by-state overview
Queensland kept its lead, holding 56% of national capacity and setting new records for built capacity (971,857 head) and turnoff (564,893 head). Numbers on feed eased 1%, bringing utilisation to 91%, likely reflecting day to day pen management rather than structural change.
NSW recorded the strongest capacity growth, up 7% to 527,193 head, supported by steady feeder supply. Numbers on feed were stable at 468,419 head, nudging utilisation down to 89%.
SA contracted across all indicators as seasonal conditions improved. Capacity fell to 75,084 head. Utilisation dropped to 74% and turnoff slipped to 39,636 head, with numbers on feed down to 55,790 head.
Victoria softened after last quarter’s record. Capacity fell 3% and numbers on feed dropped 12% to 63,828 head, bringing utilisation to 76%, the lowest since this quarter last year. Turnoff declined for a second consecutive quarter.
WA recorded its highest turnoff since 2020 (52,222 head). Still, numbers on feed fell 36% to 45,375 head, pulling utilisation to 50%, in line with the state’s wider seasonal swings.
Attribute content to: Erin Lukey, MLA Senior Market Information Analyst.
Information is correct at time of publication on 28 November 2025.
MLA makes no representations as to the accuracy, completeness or currency of any information contained in this publication. Your use of, or reliance on, any content is entirely at your own risk and MLA accepts no liability for any losses or damages incurred by you as a result of that use or reliance. No part of this publication may be reproduced without the prior written consent of MLA. All use of MLA publications, reports and information is subject to MLA’s Market Report and Information Terms of Use.


