Precision soil mapping: Is it worth it?
For Victorian producer, Lloyd Gollop – who manages a prime lamb enterprise near Amphitheatre in central-west Victoria – good nutrition is key to productivity and profitability.
Looking for ways to boost their feedbase to supply quality nutrition to their flock year-round, the Gollop family became one of four host properties involved in the ‘Precision soil mapping in central Victorian pastures’ Producers Demonstration Site (PDS) program.
About ‘Precision soil mapping in central Victorian pastures’The PDS was led by the Pyrenees and Smeaton BestWool/BestLamb (BWBL) groups (coordinated by Neil James, Agriculture Victoria). The project aimed to demonstrate the potential of grid sampling soil to assess nutrient variability and tailor variable rate applications (VRA) of fertiliser and ameliorants in grazing systems. Grid soil mapping provides a one pass laboratory method of testing a paddock for variability in pH and nutrient levels. It is currently the most accurate method for developing VRA – which utilises variable rate technology - to match fertiliser rates to pasture requirements across an entire paddock. “Soil characteristics and nutrient levels across our grazing paddocks can be highly variable due to soil type, stock camps, landscape variation, and water movement and management,” Lloyd said. “Joining this PDS provided an opportunity to map the distribution of soil nutrients across two neighbouring paddocks, apply a blanket rate of single superphosphate (SSP) fertiliser rate to one and VRA to the other, and re-map nutrients three years later to demonstrate the impact of VRA within a dynamic livestock system.” |
The site
The landscape of the Gollop family property is undulating with featured granite hills.
The property typically sees an average annual rainfall of 500–550mm. However, during the 4-year PDS project, it received much higher levels of rain from 2022–2024.
“Traditionally, we undertake soil sampling every 4–5 years in line with our pasture renovation program,” Lloyd said.
“We generally apply a blanket rate of 100kg/ha SSP to our soils annually, adding lime every 8–10 years.”
“Our pasture base across the farm is primarily cocksfoot, fescue and sub-clover, with some phalaris/clover.”
“As this is a winter-active pasture system, stock are maintained throughout the summer on fodder crops with supplementary feeding of grain.”
“A fescue and subclover paddock that had recently been subdivided into two was chosen for this PDS, resulting in the VRA trial paddock sitting immediately above the control (blanket fertiliser) site.”
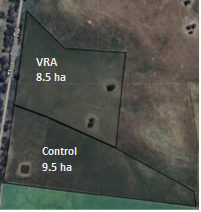
Aerial view of the demonstration site at the Gollop’s property.
The demonstration
Commencing their demonstration in December 2020, grid-based soil sampling was used to assess variability in soil nutrients across both the VRA and control paddocks.
According to Lloyd, the paddocks were sampled (0–10cm depth) on a 1ha grid resolution to understand soil variability.
“Soil samples were tested at an accredited laboratory for pH (CaCl2), Olsen phosphorous (P), and exchangeable cations such as potassium (K), magnesium (Mg), sodium (Na) and calcium (Ca),” he said.
“Subsoil samples from approximately every tenth grid square were also collected at lower resolution in 0–5, 5–10, 10–15 and 15–20cm increments to allow for any pH stratification issues to be identified.
“Based on these soil test results, we were able to develop targets and determine application rates.”
For the Gollops, an Olsen P (which refers to a soil test that assesses the level of phosphorus available to pastures) of 15mg/kg was chosen as their desired target.
To achieve this, paddock treatments included:
|
Control paddock (blanket rate): |
|
|
Year 1 |
100kg/ha SSP |
|
Year 2 |
150kg/ha SSP |
|
Year 3 |
102kg/ha SSP |
|
Total |
352kg/ha SSP |
|
VRA paddock: |
|
|
Year 1 |
average of 168kg/ha SSP |
|
Year 2* |
average of 112kg/ha SSP |
|
Year 3* |
average of 67kg/ha SSP |
|
Total |
average of 346kg/ha SSP |
* In years two and three, the decision was made not to apply fertiliser to areas within the VRA paddock which had an initial Olsen P greater than 20 mg/kg – significantly reducing the maintenance P used.
Annual application maps for the VRA paddock are shown in Figure 1.

Figure 1: VRA single superphosphate (SSP) applications over 3 years, combining capital and maintenance fertiliser requirements.
The results
Throughout the project, pasture composition, feed on offer, stocking rate and pasture quality were monitored to assess any impact on pasture production.
The control paddock started with an average Olsen P of 11.5mg/kg (range 7–19mg/kg) in 2020 and fell to an average of 8mg/kg (range 5–13 mg/kg) when re-tested in 2023.
The VRA paddock started with an average Olsen P of 16mg/kg (range 8–33mg/kg), with the higher levels seen across a hilltop that was used by sheep as a camp.
However, as the trials progressed, phosphorus levels also fell across the whole paddock to an average of 13mg/kg – except for an area on the hilltop, which increased to an Olsen P of 38mg/kg as shown in Figure 2.

Figure 2: 2020 and 2023 pre/post Olsen P soil map.
“I was surprised by the overall drop in Olsen P,” Lloyd said.
“However, we had increased stocking rates in both paddocks during the trial to better manage the fescue pasture. This decision is likely what shifted nutrients to sheep camps and exported it off the paddocks.
“It is also likely that the new subdivision fence to the south of the paddock caused a slight shift of the stock camp area – further impacting nutrient variability.”
Throughout the three-year demonstration, distribution of other soil attributes also changed – even though they were not targeted through fertiliser or ameliorant applications.
Figure 3 shows changes in pH and potassium, which followed a similar redistribution (to higher points in the landscape) as phosphorus.

Figure 3: 2020 and 2023 pre and post- trial pH (CaCl2) and potassium (mg/kg) soil maps.
Cost breakdown
Focusing on the costs relative to pasture production, Lloyd noted there were large differences in the soil sampling costs of each treatment site.
“The 8.5ha VRA paddock equated to $637.50 – almost double that of the control paddock,” he said.
“However, if we sampled at a 2ha grid size – which is commonly used in broadacre situations and produces meaningful variable rate outcomes despite the lower resolution – it would reduce future VRA sampling costs.
“The cost of fertiliser applied was similar between the two paddocks, however the VRA paddock had a higher sampling cost, leading to $211/ha compared to $145 for the control paddock for soil testing and fertiliser combined.”
|
|
Control |
VRA |
|
Total soil sampling cost ($/ha) |
$9 |
$75 |
|
Total capital fertiliser cost ($/ha) |
$0 |
$61 |
|
Total maintenance fertiliser cost ($/ha) |
$136 |
$75 |
|
Total treatment cost ($/ha) |
$145 |
$211 |
|
Total 3-year pasture growth (tDM/ha) |
21.0 |
21.9 |
|
Total treatment cost ($/tDM) |
$7 |
$10 |
Comparison of three year (2021–2023) costs and pasture growth of the two soil management treatments.
The takeaways
Despite not achieving the outcomes he hoped to receive through precision soil mapping, Lloyd has left the demonstration with some key insights he believe will improve his business.
“The demonstration highlighted the importance of re-sampling paddocks over time to understand trends and impacts of applications – as well as animal movements within paddocks and across the farm,” he said.
“I plan to continue to soil test and apply nutrients at those lower sitting areas of the paddocks as I now know my sheep will move it up the hill to the camp areas – that in itself is a key money saving opportunity precision soil mapping has found.”