‘Kidman Springs Station’, Victoria River District, Northern Territory
The Northern Territory Department of Industry Tourism and Trade (NT DITT) conducted a phosphorus (P) supplementation trial at Victoria River Research Station (known locally as ‘Kidman Springs’) from 2014 to 2019. The trial was designed to provide objective measurements for beef producers on the benefits of P supplementation of breeders grazing native pastures typical of the Victoria River District (VRD).
Kidman Springs covers approximately 31,400ha in the VRD about 220km south-west of Katherine, NT. The VRD contains three main soil types which include cracking clays, calcareous red earths and sandy red earths. The soils are neutral to slightly alkaline and are mostly phosphorus-deficient (<5mg/kg Colwell phosphorus). Like many parts of northern Australia, the district has a distinct monsoonal wet season (November to March) followed by a dry season (April to October). Kidman Springs receives an average rainfall of 760mm with most falling between December and March.
In recent years, phosphorus supplementation has been a major aspect of research at Kidman Springs. Depending on the season, Kidman Springs runs approximately 880 Brahman breeders managed extensively, comparable with most commercial properties in the region. The supplementation program has involved supplying urea/salt dry mixes during the dry season and phosphorus/salt dry mixes during the wet season.
Routine management of the breeder herd has involved:
- two mustering rounds for weaning
- husbandry practices including vaccination against botulism and vibriosis
- data collection including pregnancy testing and measurements of weight, height, body condition and lactation status
- blood sampling as required.
Typically, the first weaning round is completed in May with a second-round muster in September prior to the start of calving. Following weaning, heifers are kept separate from older breeders until they have weaned their first calf at approximately three-and-a-half years old. They are mated for the first time at two years of age to young bulls, from mid-December to the end of March. Pasture assessments are conducted each year by rangeland scientists and this information is used to set the stocking rate for each paddock.
In May 2014, 179 Brahman weaner heifers were assigned randomly to two supplementation strategies:
- No P supplementation (-P) and
- with P supplementation (+P).
Loose lick supplements provided by Ridley AgriProducts were fed to both groups; the dry season supplement fed to the +P group contained P (25% MCP, 25% urea, 10% Gran Am., 40% salt, 1% trace minerals) whereas the lick fed to the -P group did not contain P (25% urea, 10% Gran Am., 64% salt, 1% trace minerals).
The +P wet season lick contained 42.5% MCP, 7.5% Gran Am., 50% salt. The -P wet season lick did not contain any P (73.5% salt, 7.5% Gran Am., 19% limestone). The two groups grazed adjoining paddocks and the herds switched paddocks annually to minimise any paddock effects.
The two groups were managed the same way except for their supplement so that differences were a result of the P supplement. No animals were culled during the study and any losses were replaced to maintain constant stocking rates.
However, the replacement cattle were not included in the measured performance of the two herds.
Trial results
The average liveweights (LW) of the heifers in the two treatments at the start of the study were very similar (~174kg).
There was no difference in growth rate during the first postweaning dry season (May to October 2014) but +P animals gained 33kg more over the 2014–15 wet season. The average liveweight of the +P supplemented animals were heavier at every muster from this time onwards (Figure CS1.1). For example, lactating cows in the +P supplemented group were >100kg heavier compared to the non-P supplemented group at weaning musters.
The pregnancy rates of each treatment at each muster are shown in Table CS1.1. The data is shown for all animals (All) as well as for each lactational status (wet and dry). The group fed the P supplement had greater pregnancy rates than the group without P supplement.
The mortality rate in each year (Table CS1.2) was greater in the non-P supplemented cows and by May 2019 14.8% of the animals originally allocated to the -P treatment had died/gone missing compared with 2.3% from the +P treatment.
The mortality rate in the -P cows would have been greater but lactating cows with a body condition score of less than two were removed from the trial for welfare reasons in 2017 and 2019. These animals were supplementary fed until they improved. In May 2019, the trial was concluded a year earlier than planned because several of the lactating cows from the -P treatment were showing symptoms of peg leg and were in poor body condition.
Figure CS1.1: Growth path data for all cows (lactating and non-lactating) in the -P and +P treatments (points represent times where cattle were weighed)
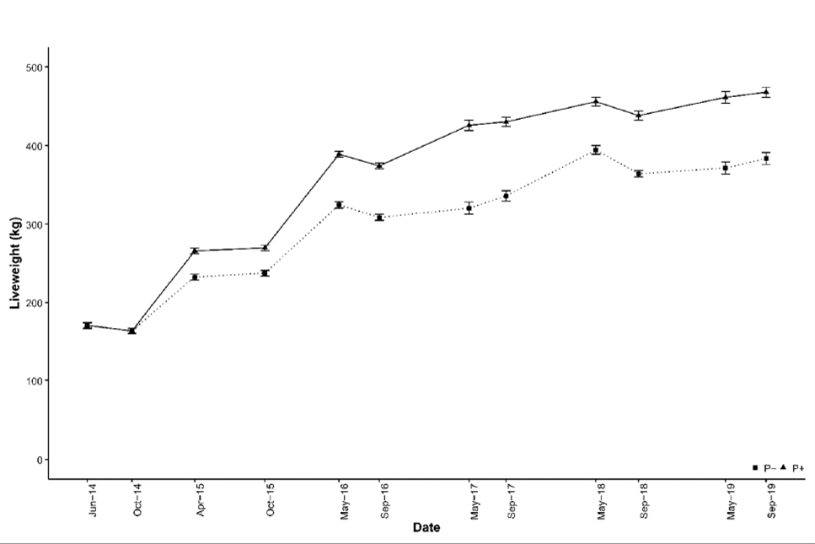
Table CS1.1: The pregnancy percentages of each treatment at the first-round weaning musters in each year
|
Lactation |
Dry |
Wet |
All |
|||
|
Treatment |
-P |
+P |
-P |
+P |
-P |
+P |
|
2016 |
60.2% |
70.0% |
|
|
|
|
|
2017 |
88.2% |
90.0% |
5.1% |
30.0% |
46.9% |
56.7% |
|
2018 |
96.0% |
95.8% |
20.0% |
59.6% |
67.5% |
78.9% |
|
2019 |
84.8% |
92.9% |
9.3% |
75.4% |
42.1% |
80.9% |
Table CS1.2: The mortality rates (percentage of animals that died/went missing) in each treatment throughout the study
|
|
Cumulative mortality rate |
|
|
P- |
P+ |
|
|
Starting number |
|
|
|
2014/15 |
2.3% |
1.1% |
|
2015/16 |
5.7% |
1.1% |
|
2016/17 |
8.0% |
1.1% |
|
2017/18 |
9.1% |
1.1% |
|
2018/19 |
14.8% |
2.2% |
The productivity in terms of kilograms of beef produced from each treatment was substantially higher for the +P herd. Over the five years of the trial, 60,146kg of liveweight was produced from the +P group compared to 34,099kg from the -P group (Table CS1.3). An extra $7,899 was spent on supplement for the +P group and $62,235 more value of weight was produced if both treatments had started with 100 heifers.
Data from the first four years of this study was used to model the effect of P supplementation on an average herd in the Katherine (NT) region (see Table 7.1 in Chapter 7). Researchers found that it resulted in a large increase in annual business profit (>AU$500,000) and had an internal rate of return of 172%. The result confirms that P supplementation was very profitable in this case study.
Conclusion
The performance of breeder cows fed P supplementation in the Kidman experiment was a significant improvement compared with breeders not fed P under the same paddock conditions. The economic analysis (refer Chapter 7) showed that it was profitable and had clear benefits in terms of animal health and welfare. The responses generated in animal performance compared to the relatively low cost of P supplementation provide a case for beef producers on P-deficient soils in northern Australia to feed P.
Table CS1.3: Summary of the production and costs of each treatment (calculated for both treatments starting with 100 heifers)
|
|
-P |
+P |
Difference (+P less -P) |
|
Total weight of calves produced (kg) |
17,464 |
29,520 |
12,056 |
|
Total increase in weight of females (kg) |
13,134 |
25,551 |
12,417 |
|
Total weight of beef produced (kg) |
30,598 |
55,071 |
24,472 |
|
Value of beef produced (@ cows = $1.5/kg, weaners = $3/kg) |
$72,094 |
$126,886 |
$54,792 |
|
Total value of supplement consumed |
$8,783 |
$15,872 |
$7,089 |