Restocker demand continues to soften
Key points
- Restocker demand is trending down.
- NSW restockers were significantly more affected than Queensland by exotic disease concerns in June/July 2022.
- Queensland restocking demand remains strong due to a strong improvement in seasonal conditions for the north of the state.
Restocking demand on the eastern seaboard has been softening since mid-November, although demand in Queensland has lifted considerably and currently holds a 7% premium over NSW.
EYCI
Looking at the premium between buyers (Victoria, NSW, Queensland), prices for restocker cattle have been tightening compared to feeders since mid-November 2022 (Figure 1).
This premium is trending down, although compared to the weekly average of 7% since 2019, restocker prices at present are 10% higher than feeders for the week ending Friday 3 March.
Figure 1. Restocker to feeder premium – Eastern Young Cattle Indicator (EYCI)
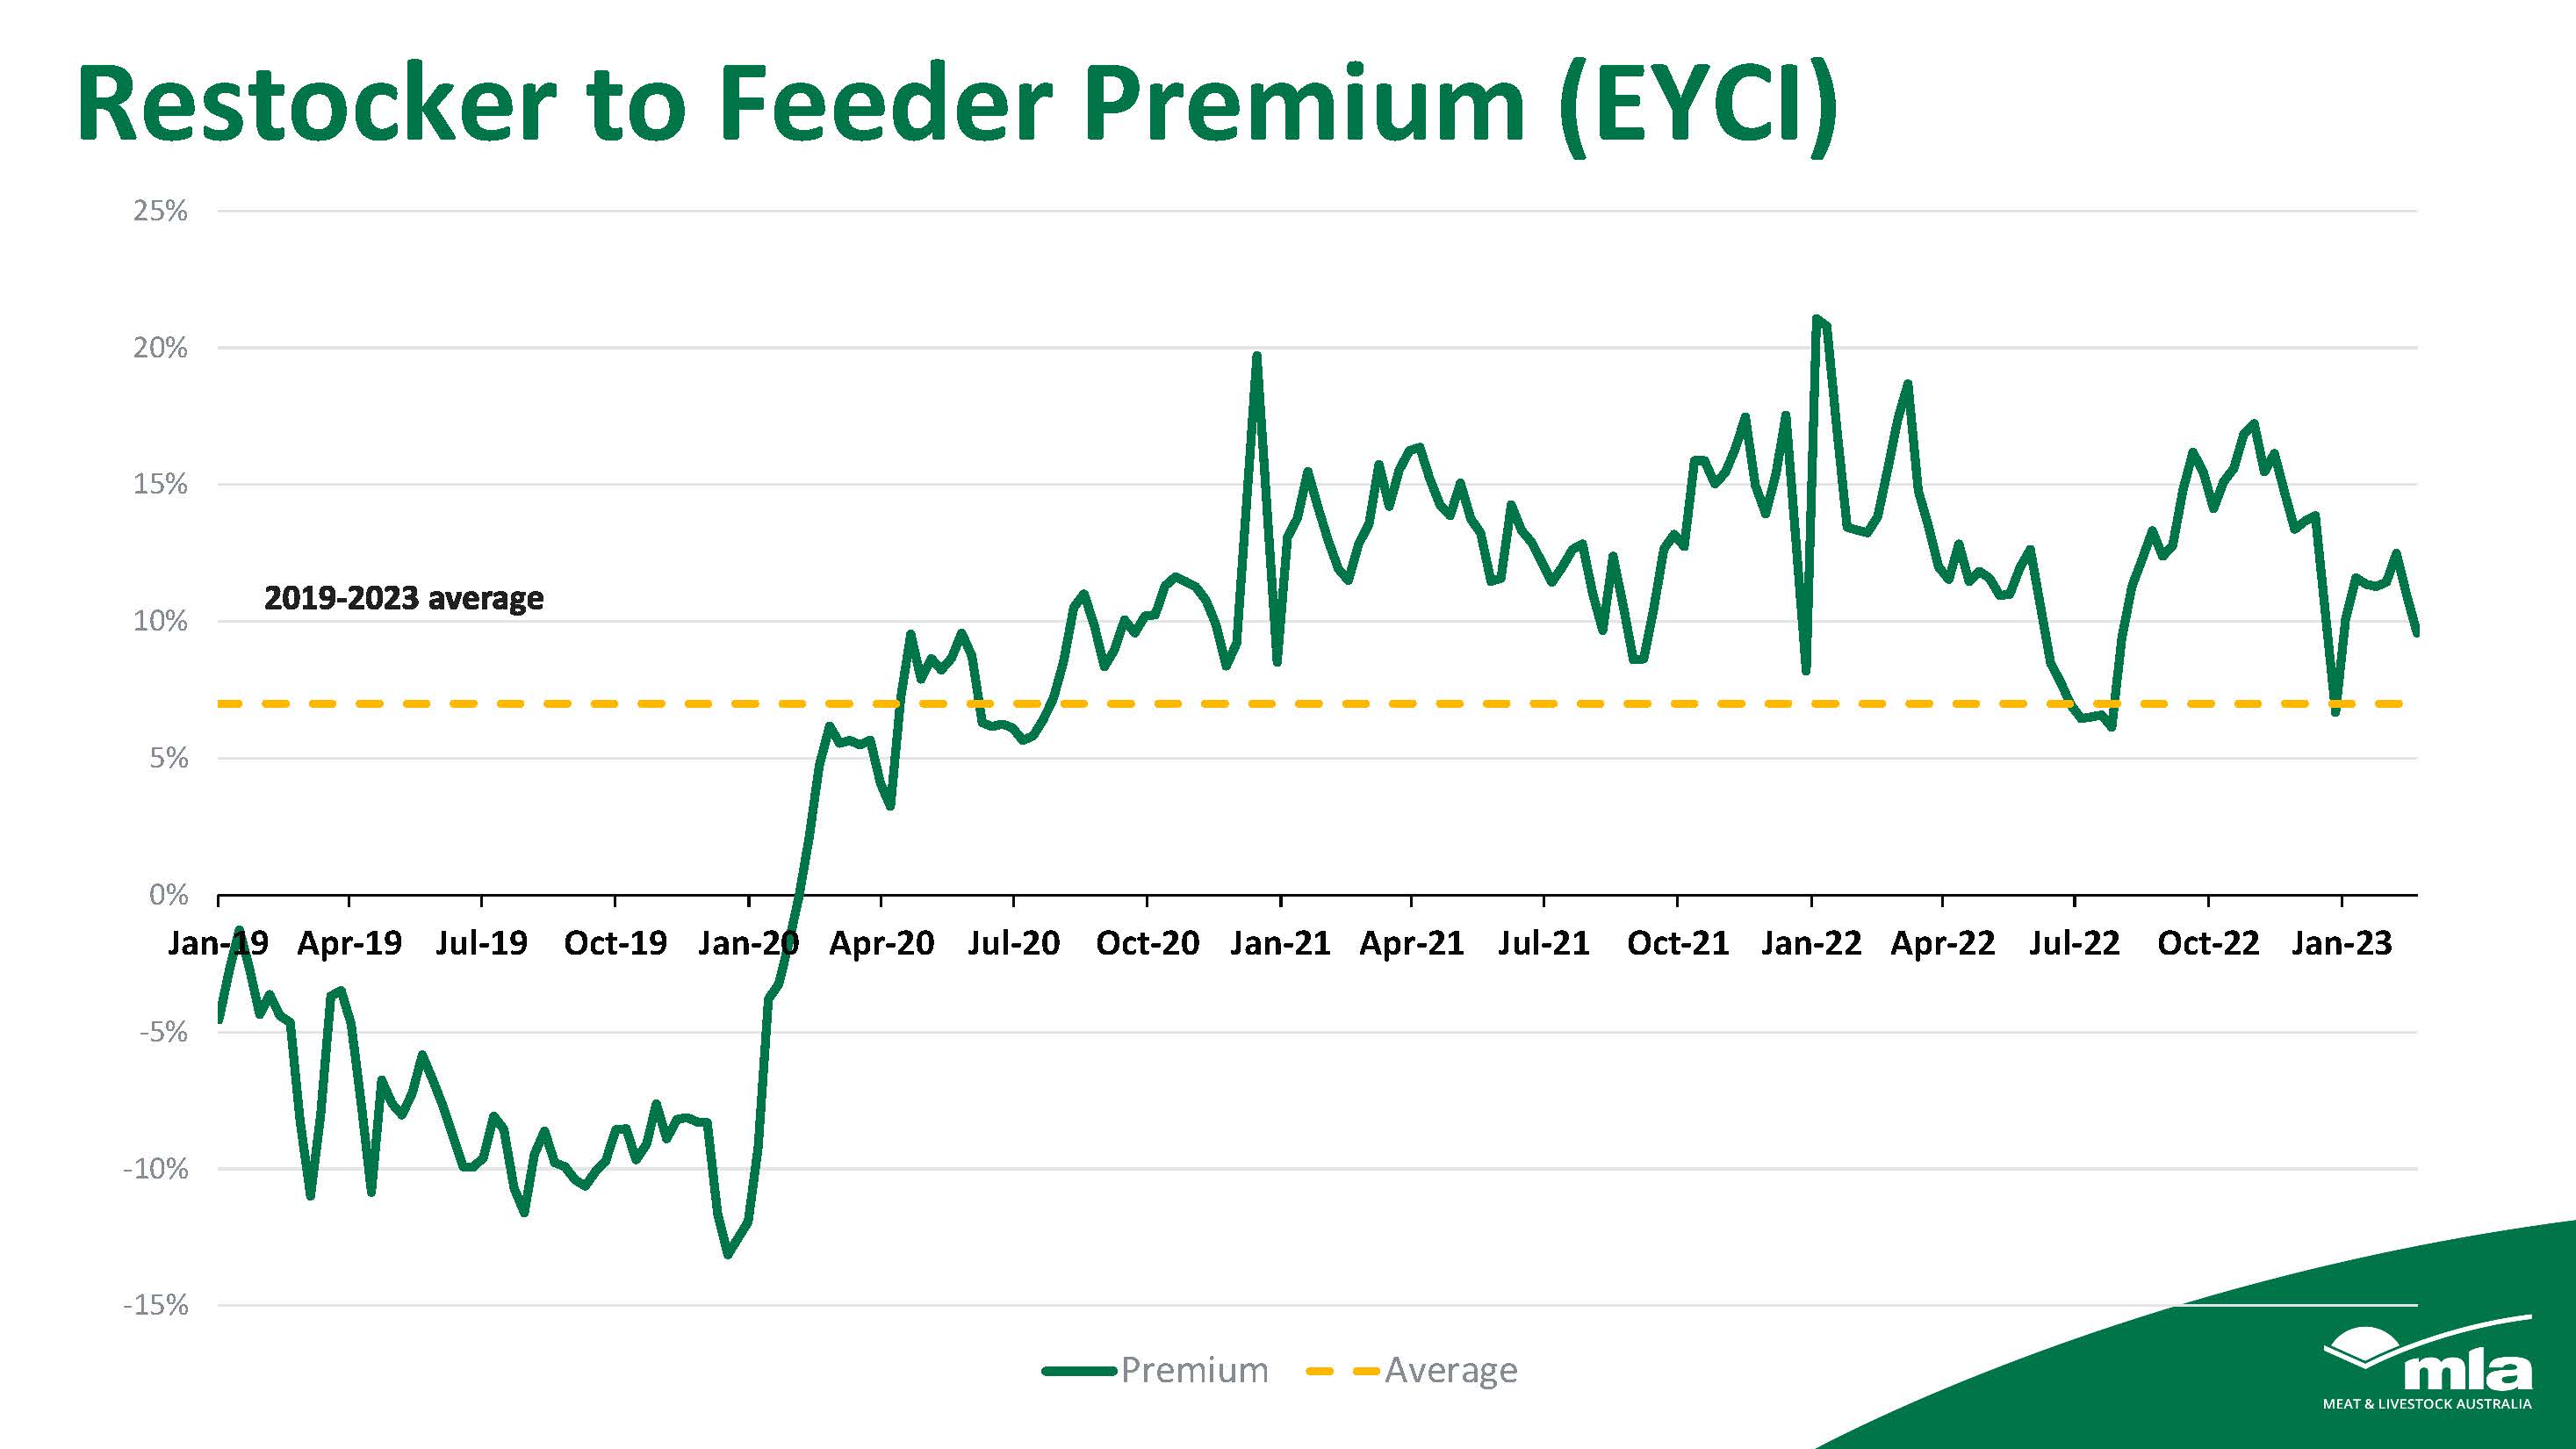
Source: Meat & Livestock Australia
Since the market opened in January, the premium has been widening between restocker and feeder prices. For buyers, the week ending 19 February proved to be a tipping point and, since then, the dynamic has reversed and the premium has fallen.
State* level
When comparing NSW and Queensland restocker to feeder premiums over the past four years, the data provides unique insights and understandings of restocker buying behaviour relevant to each state.
In June/July 2022, when a range of factors including concerns around exotic disease incursions were affecting the market, NSW restocker prices fell significantly more than Queensland’s. The NSW premium fell to 2%, while Queensland’s premium only fell to 9% and was much less drastic in nature than the NSW decline (Figure 2).
Figure 2. Restocker premium at state level
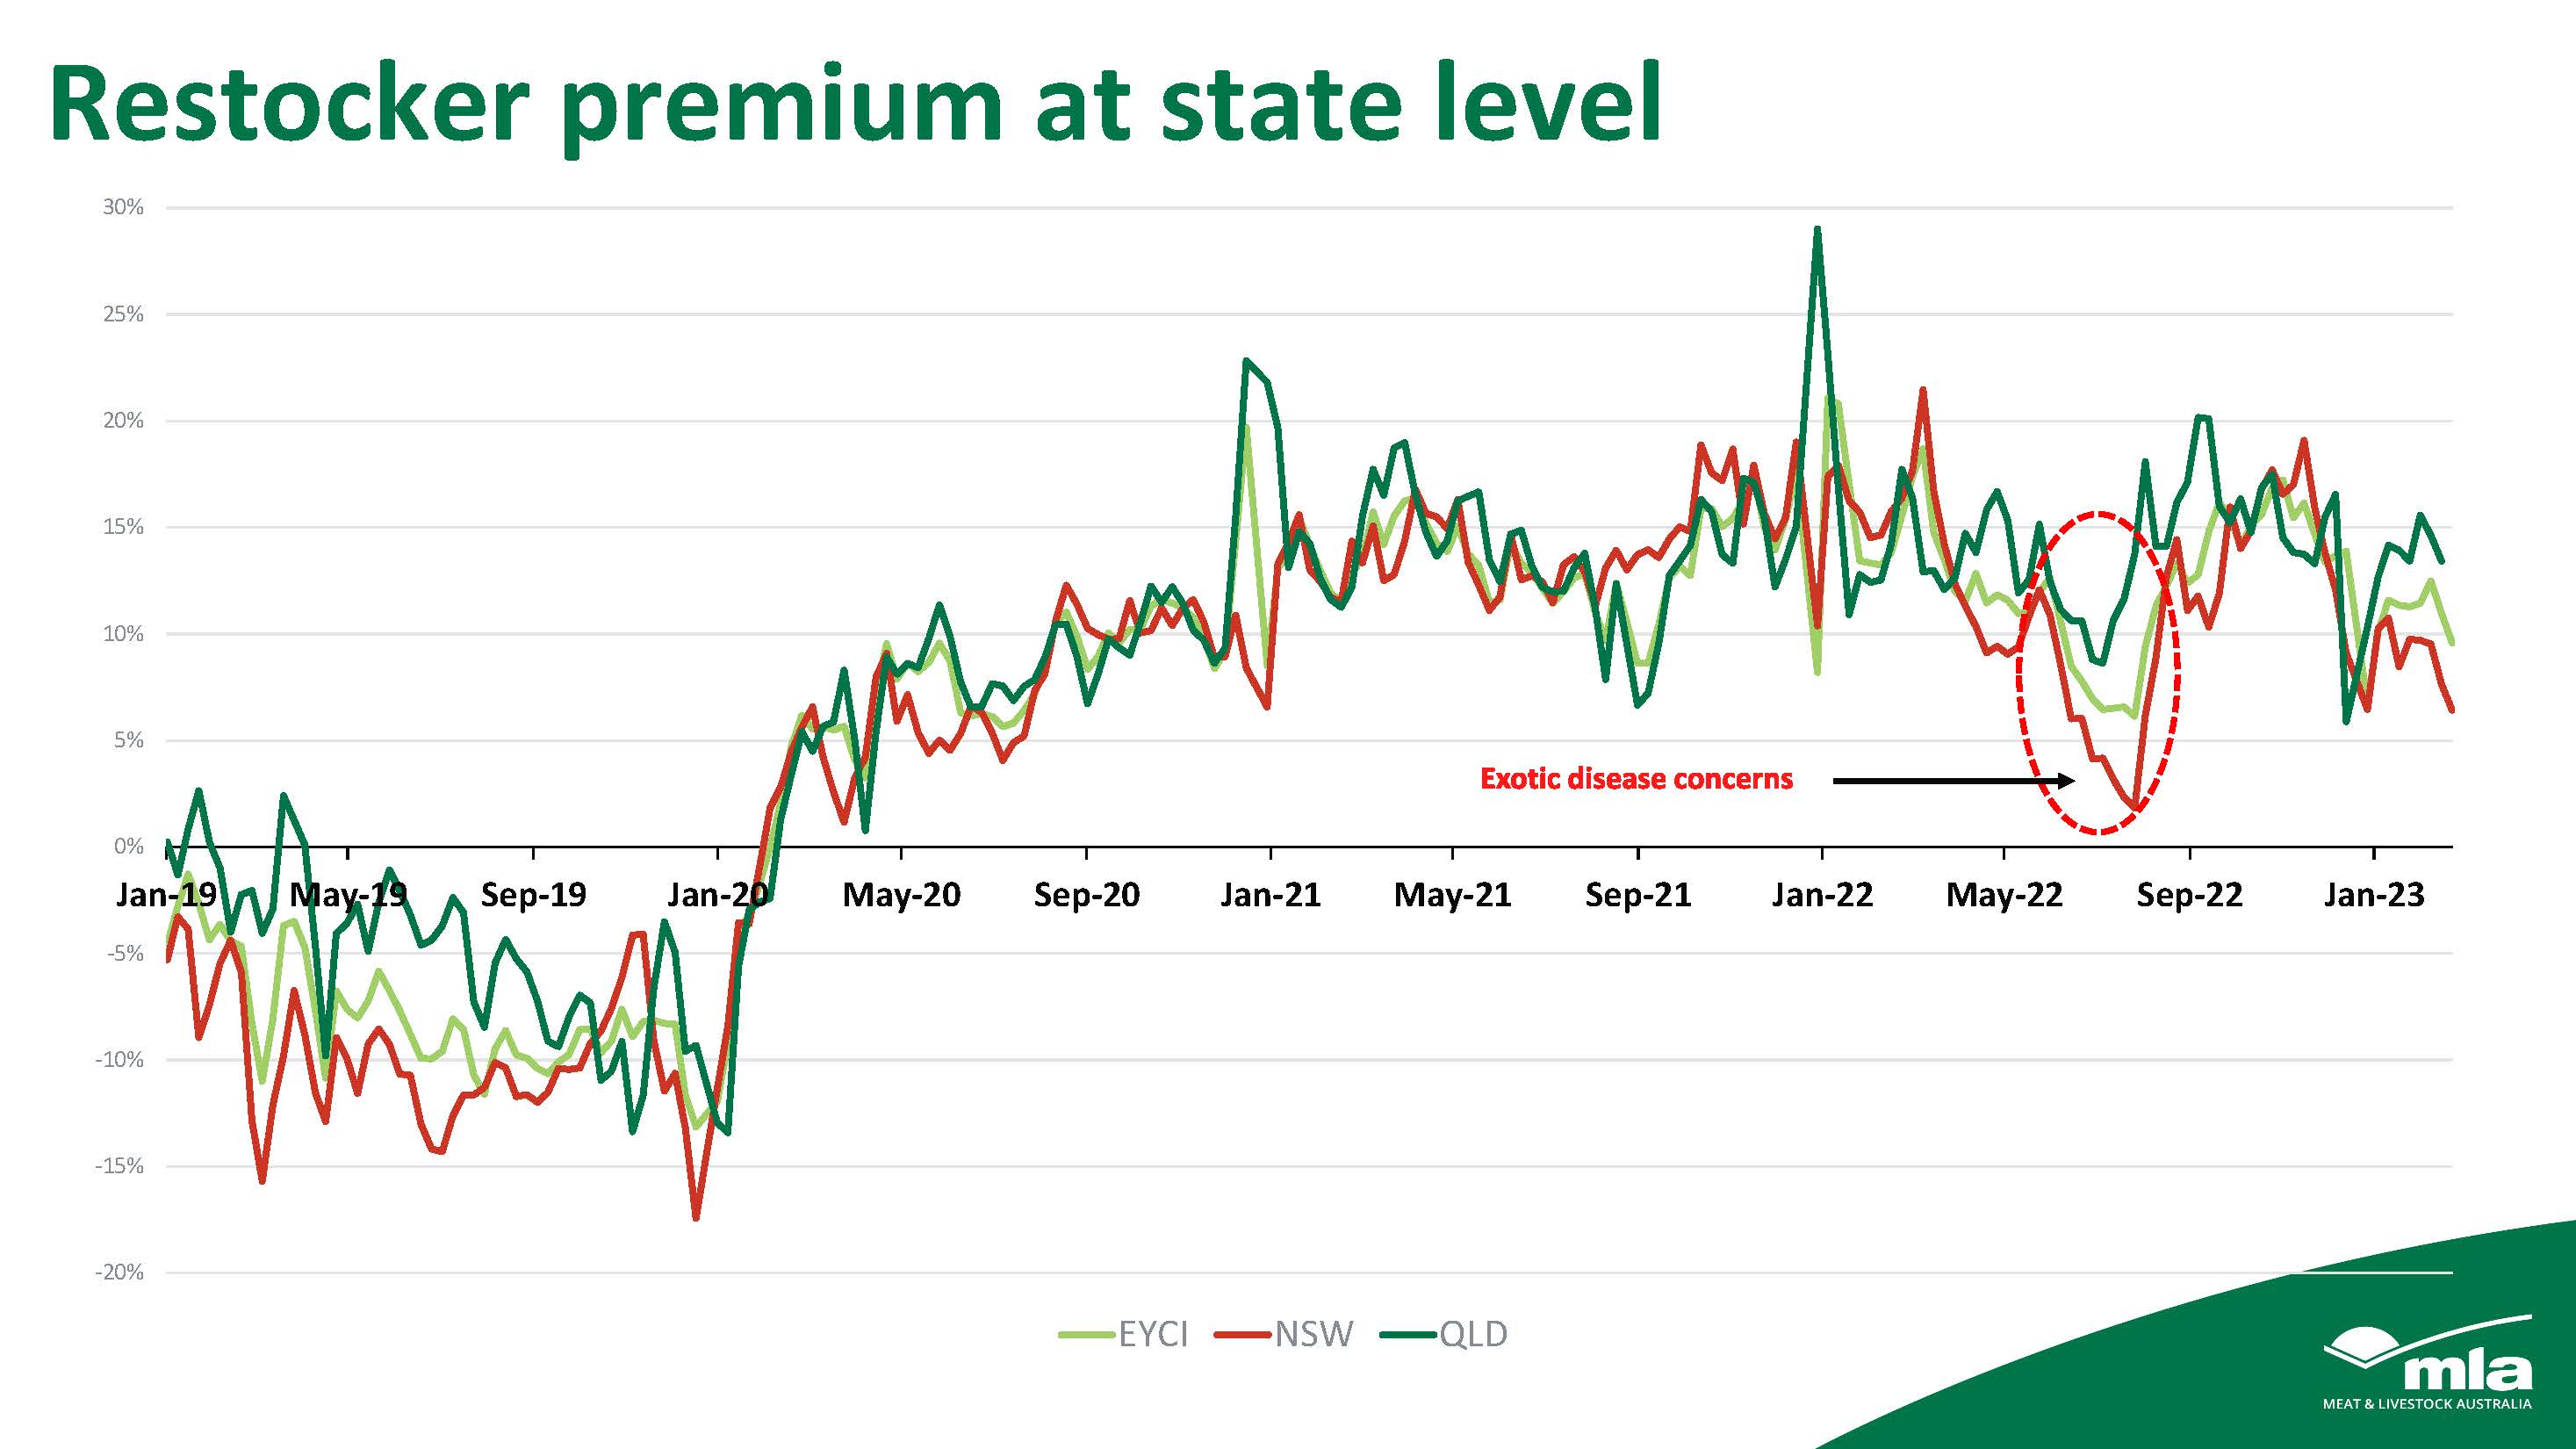
Source: Meat & Livestock Australia
This meant NSW restocker buyers were most concerned about an incursion and the market conditions at the time. This explains the erratic nature of price performance and the deeper downturn in NSW prices than Queensland’s.
Since the beginning of the year, Queensland restocking demand has lifted considerably and currently holds a premium over NSW of 7%. Comparatively, NSW restocking demand has remained relatively subdued, reflecting hotter and drier conditions in the state as well as the maturity of its herd rebuild relative to Queensland.
*Victoria was not included in this analysis as it has averaged 5.85% of total EYCI yardings on a yearly basis over the past four years.
International picture
If the US drought breaks and their beef supply contracts in 2023, this will provide support for Australian cattle prices due to tight international beef supply. However, this premium may depend on the support the US contraction places on prices domestically.
If the support proves to be significant and dry seasonal conditions persist in Australia, a feeder premium may eventuate as restockers look to capitalise on prices by offloading stock (therefore increasing supply and placing downward pressure on price).
Looking ahead
The current premium dynamic between NSW and Queensland aligns with Meat & Livestock Australia’s recent ommentary around the maturity of each state’s herd rebuild/growth position.
Demand for restocker cattle in Queensland remains strong, with large areas in the north experiencing an exceptional start to its 2023 wet season. In reflection of current dry conditions in NSW, restocking demand continues to decline. However, should generalised rain eventuate, the premium will widen once more as producer confidence returns and market demand increases.
If dry conditions persist, it’s expected that the premium at a state and eastern seaboard level will tighten, with feeder buyers continuing to operate heavily. This was seen in the 2019 drought, when a premium for feeder cattle occurred and restocker prices operated at a discount – see Figure 2 above.